Functions
Your game's server-side logic — deployed from Git, running globally, scaling automatically. Write in TypeScript, JavaScript, Python, or Go. Every push builds and ships without touching infrastructure.
The Functions section lives under Engineering in the project sidebar. Five tabs give you everything: Overview, Functions, Bindings, Logs, and History.
Overview
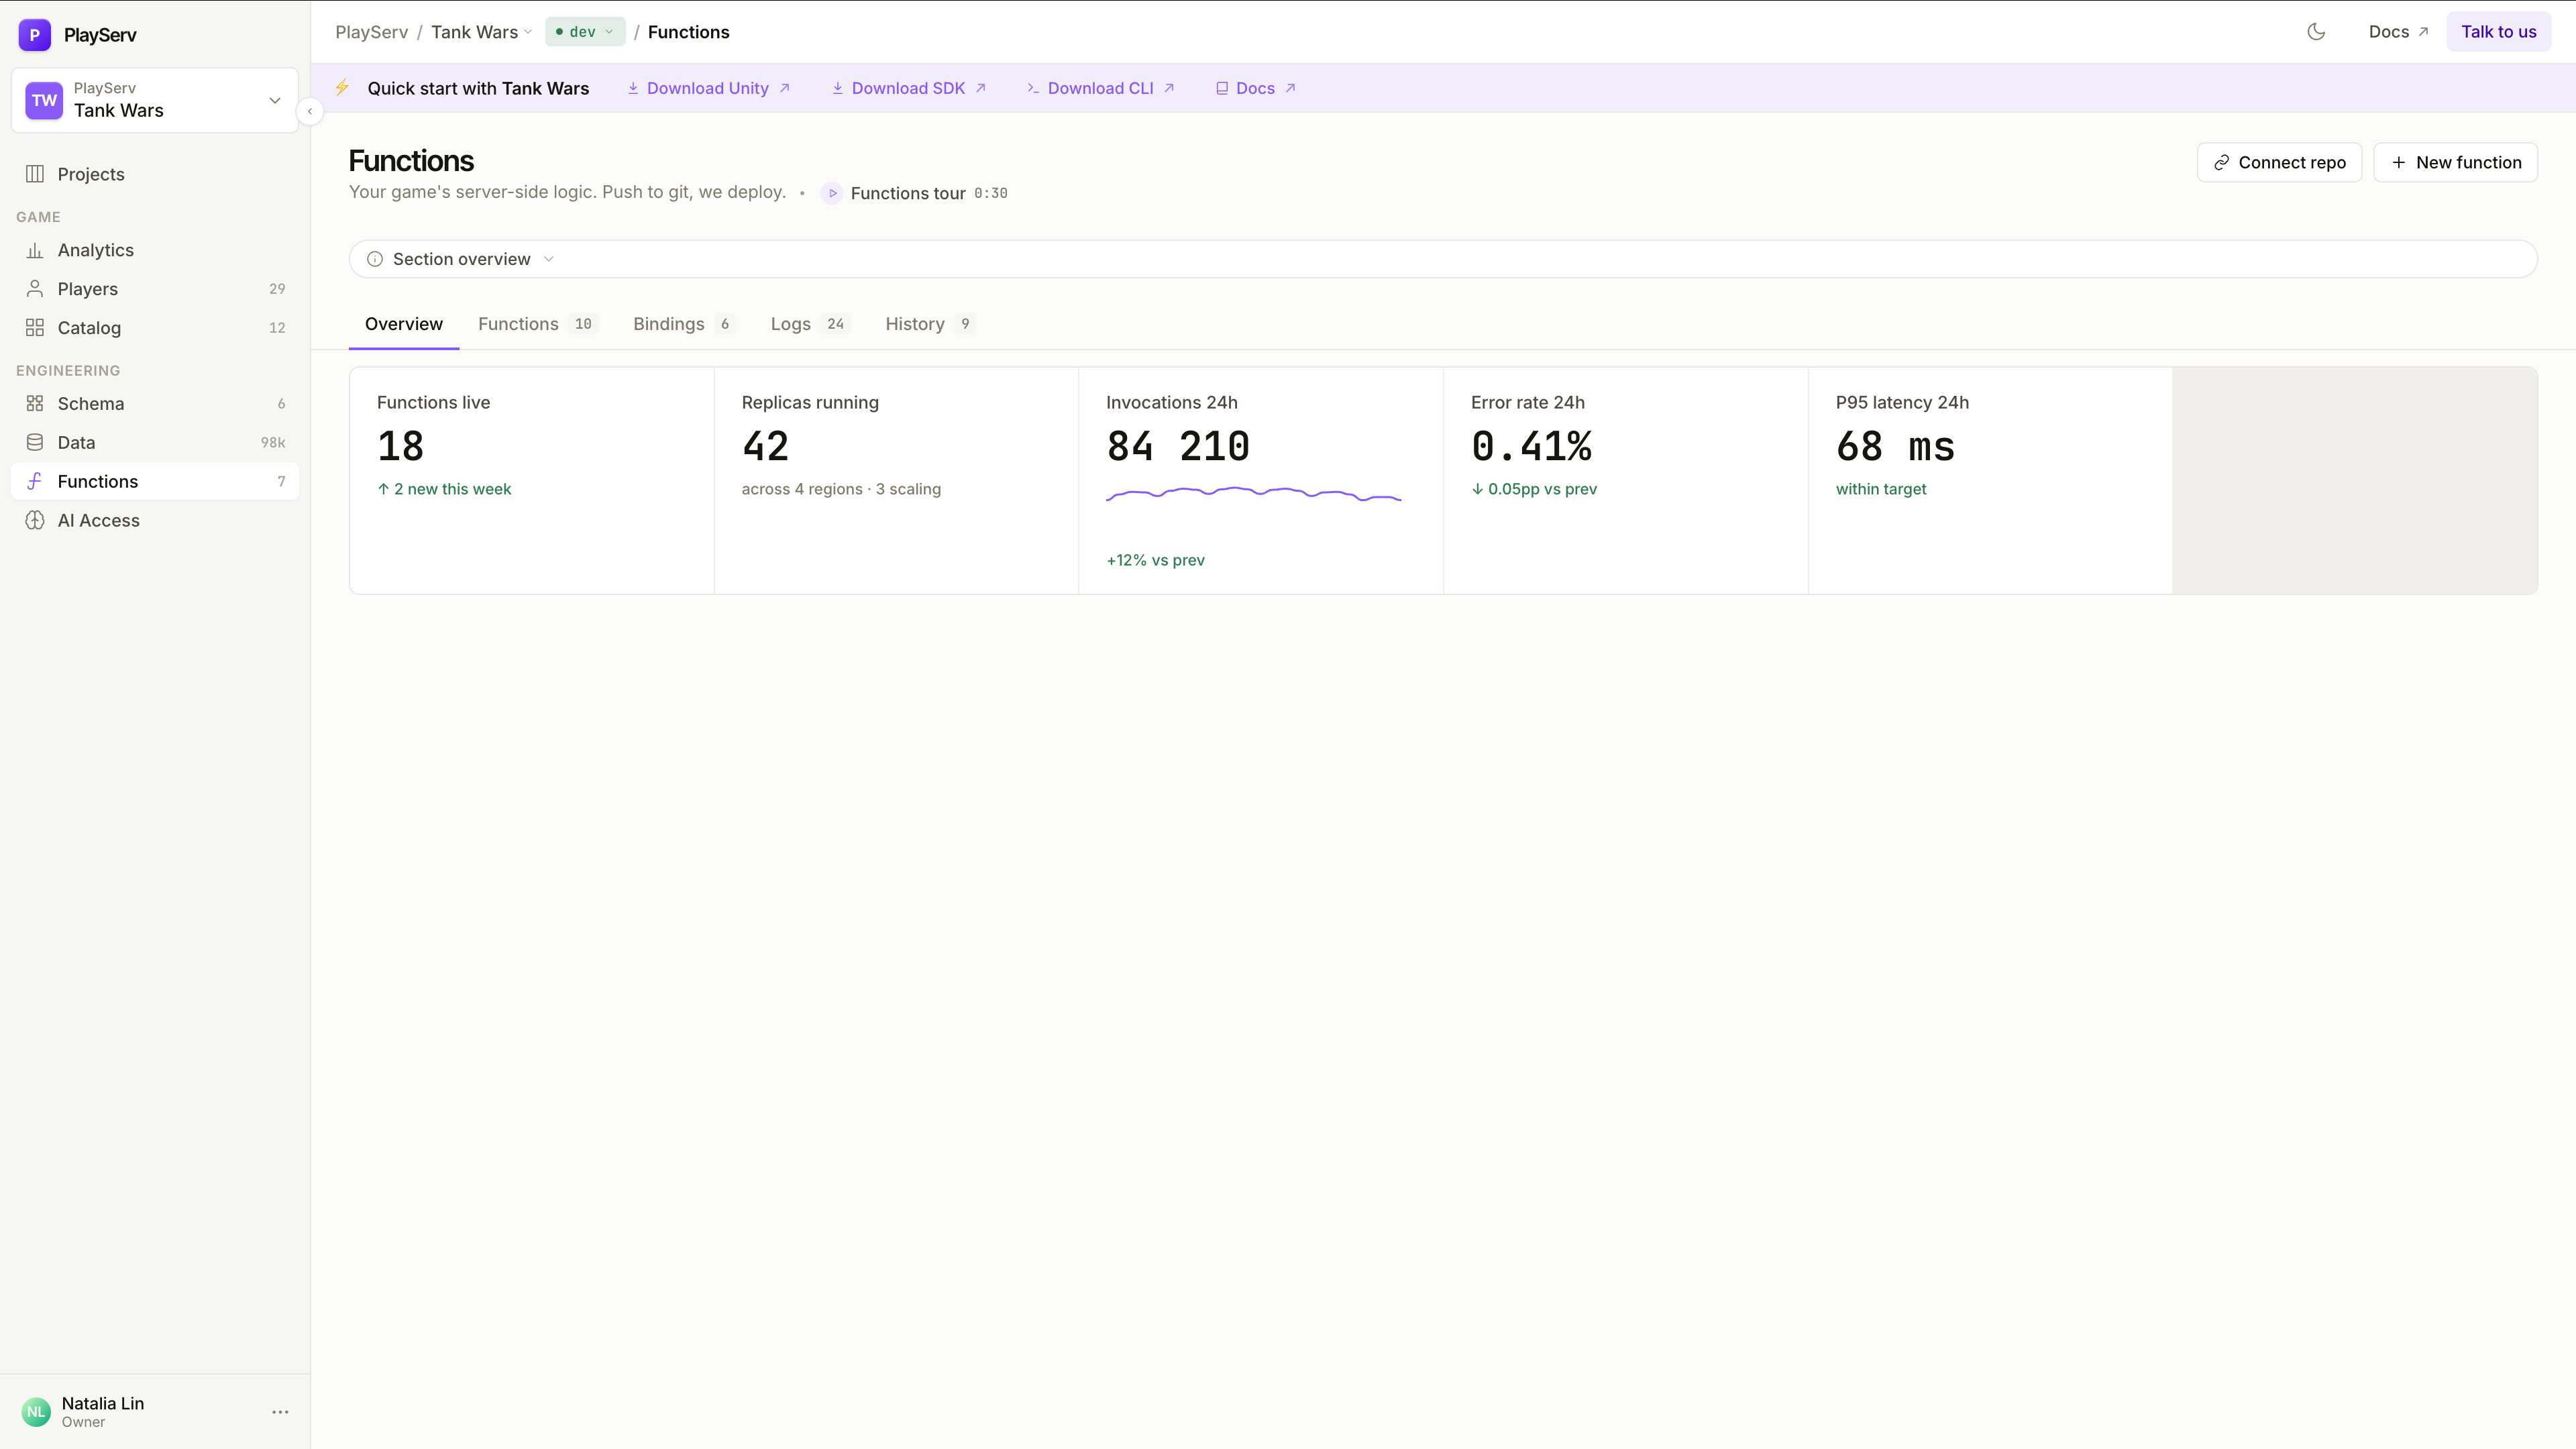
A live health dashboard across all your functions in the current environment.
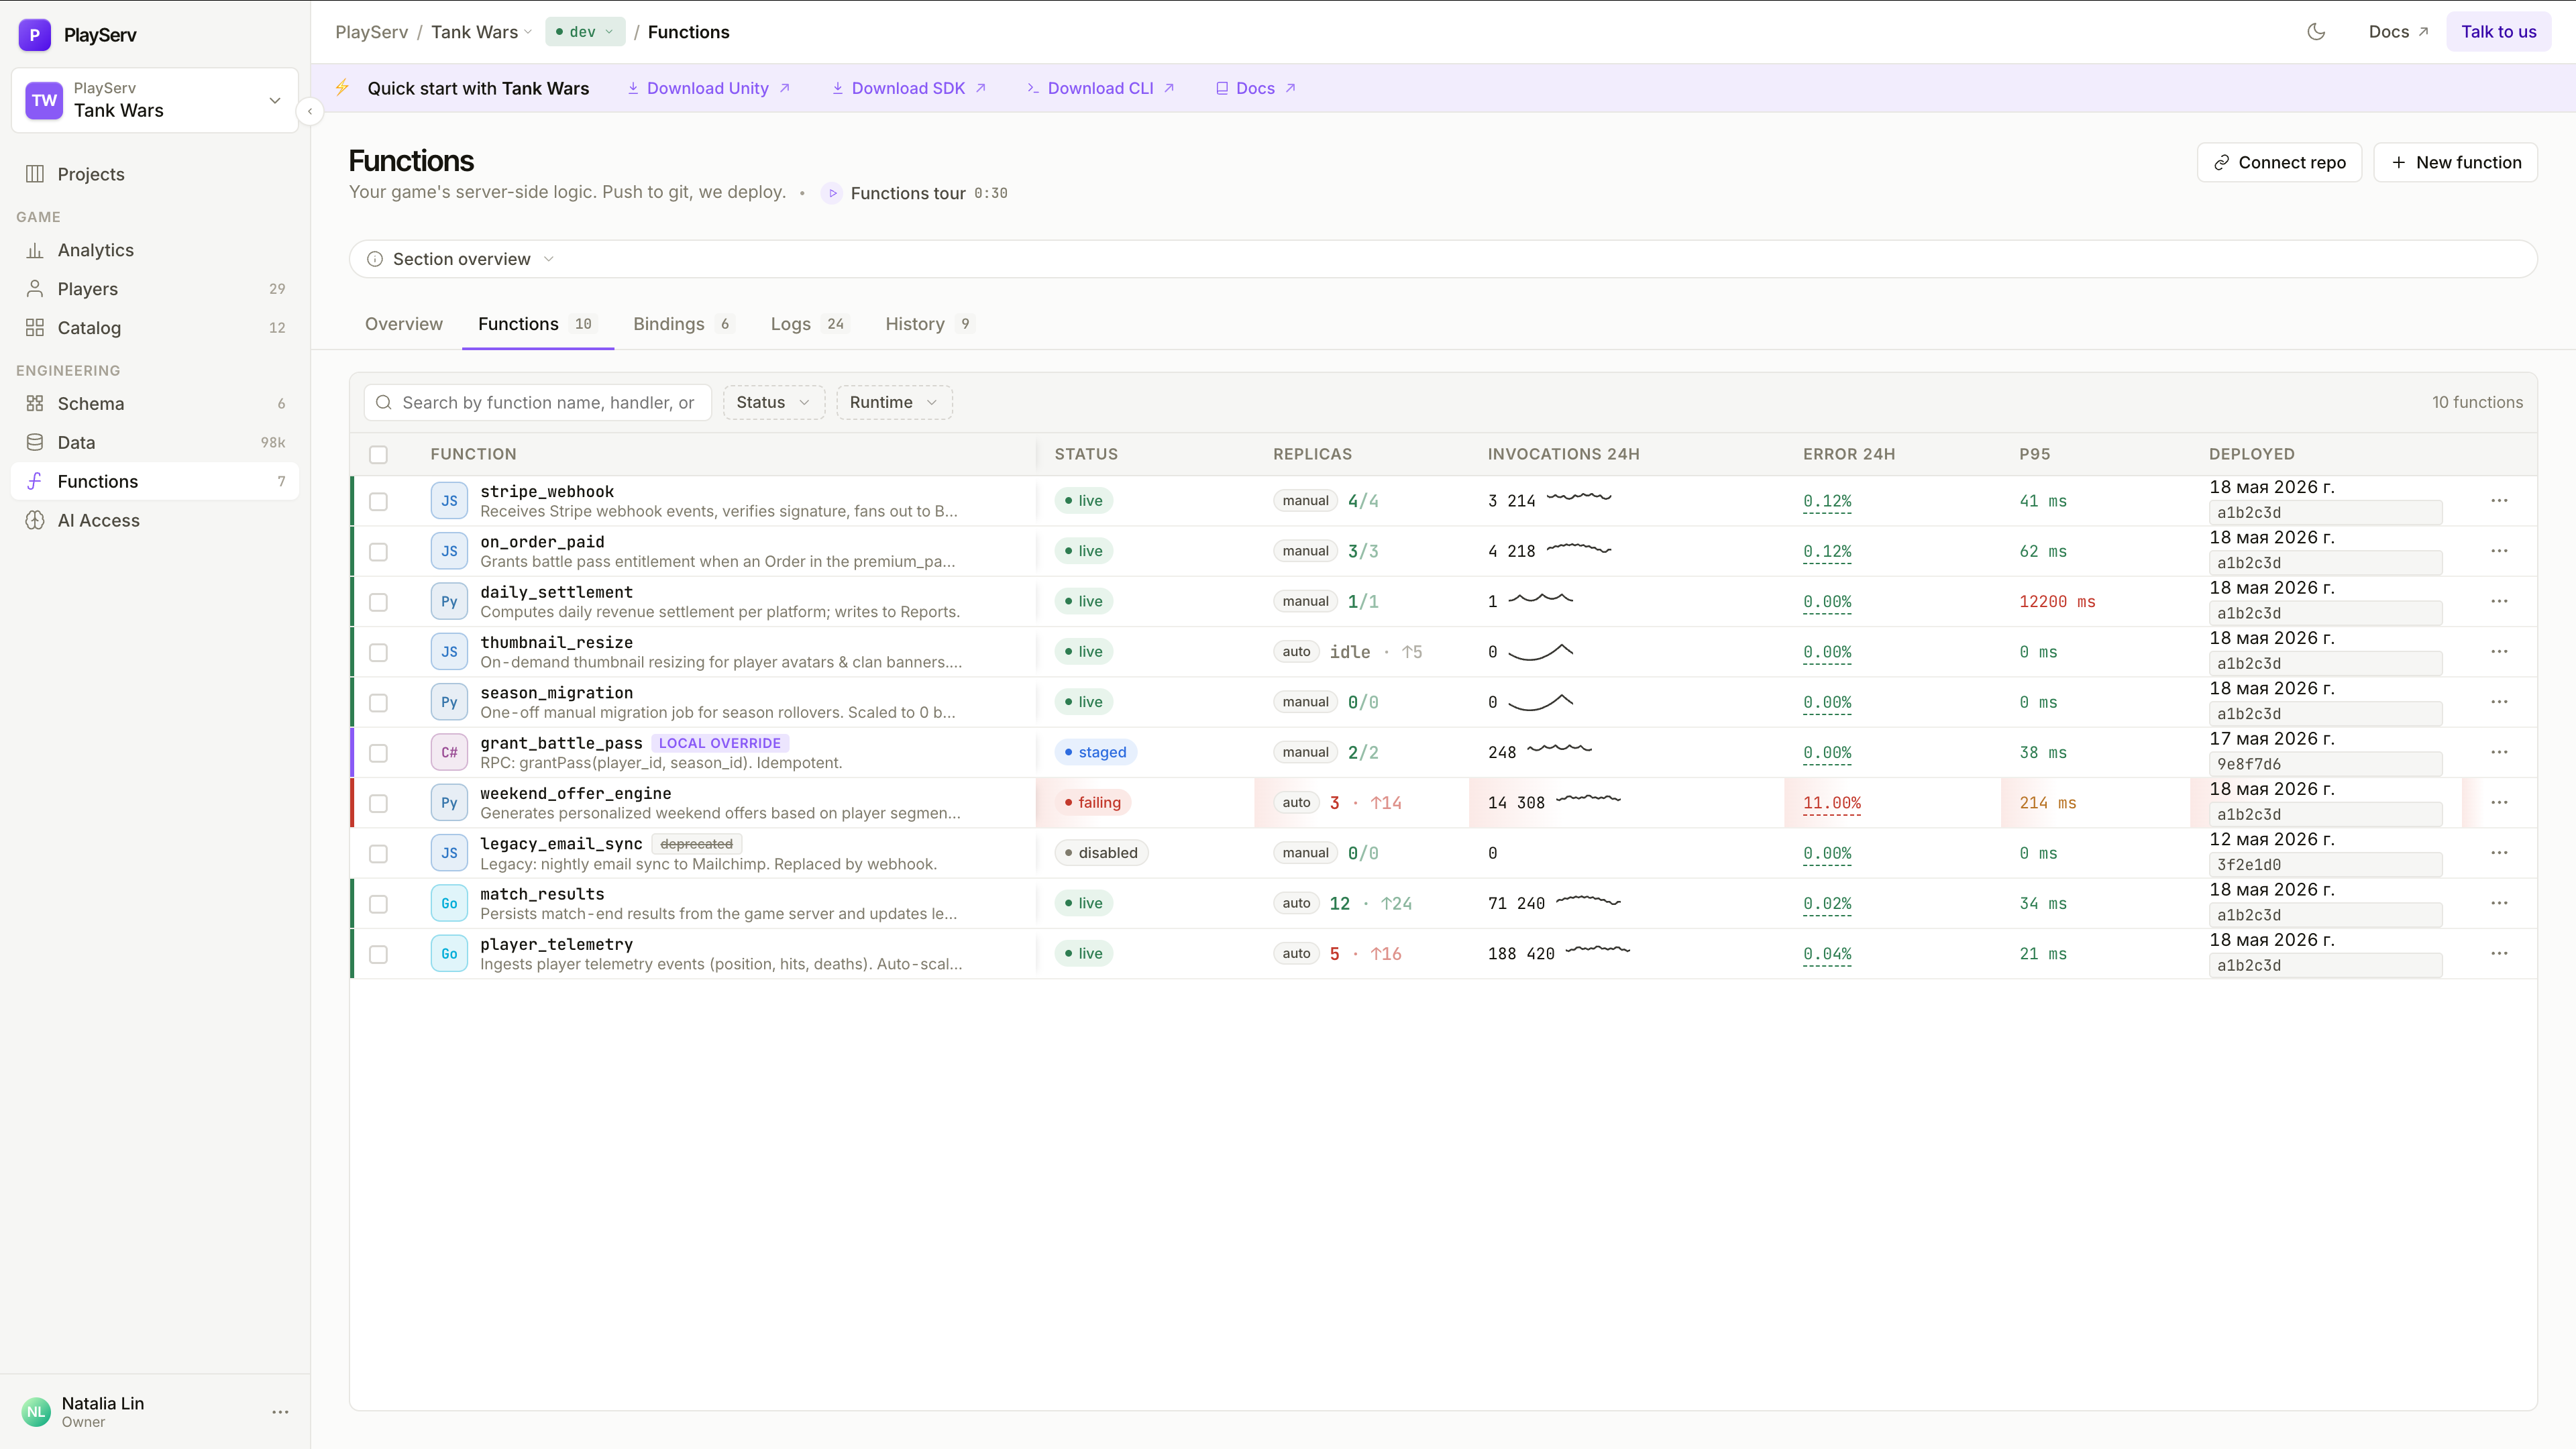
Functions list
Every function in the project, in one table.
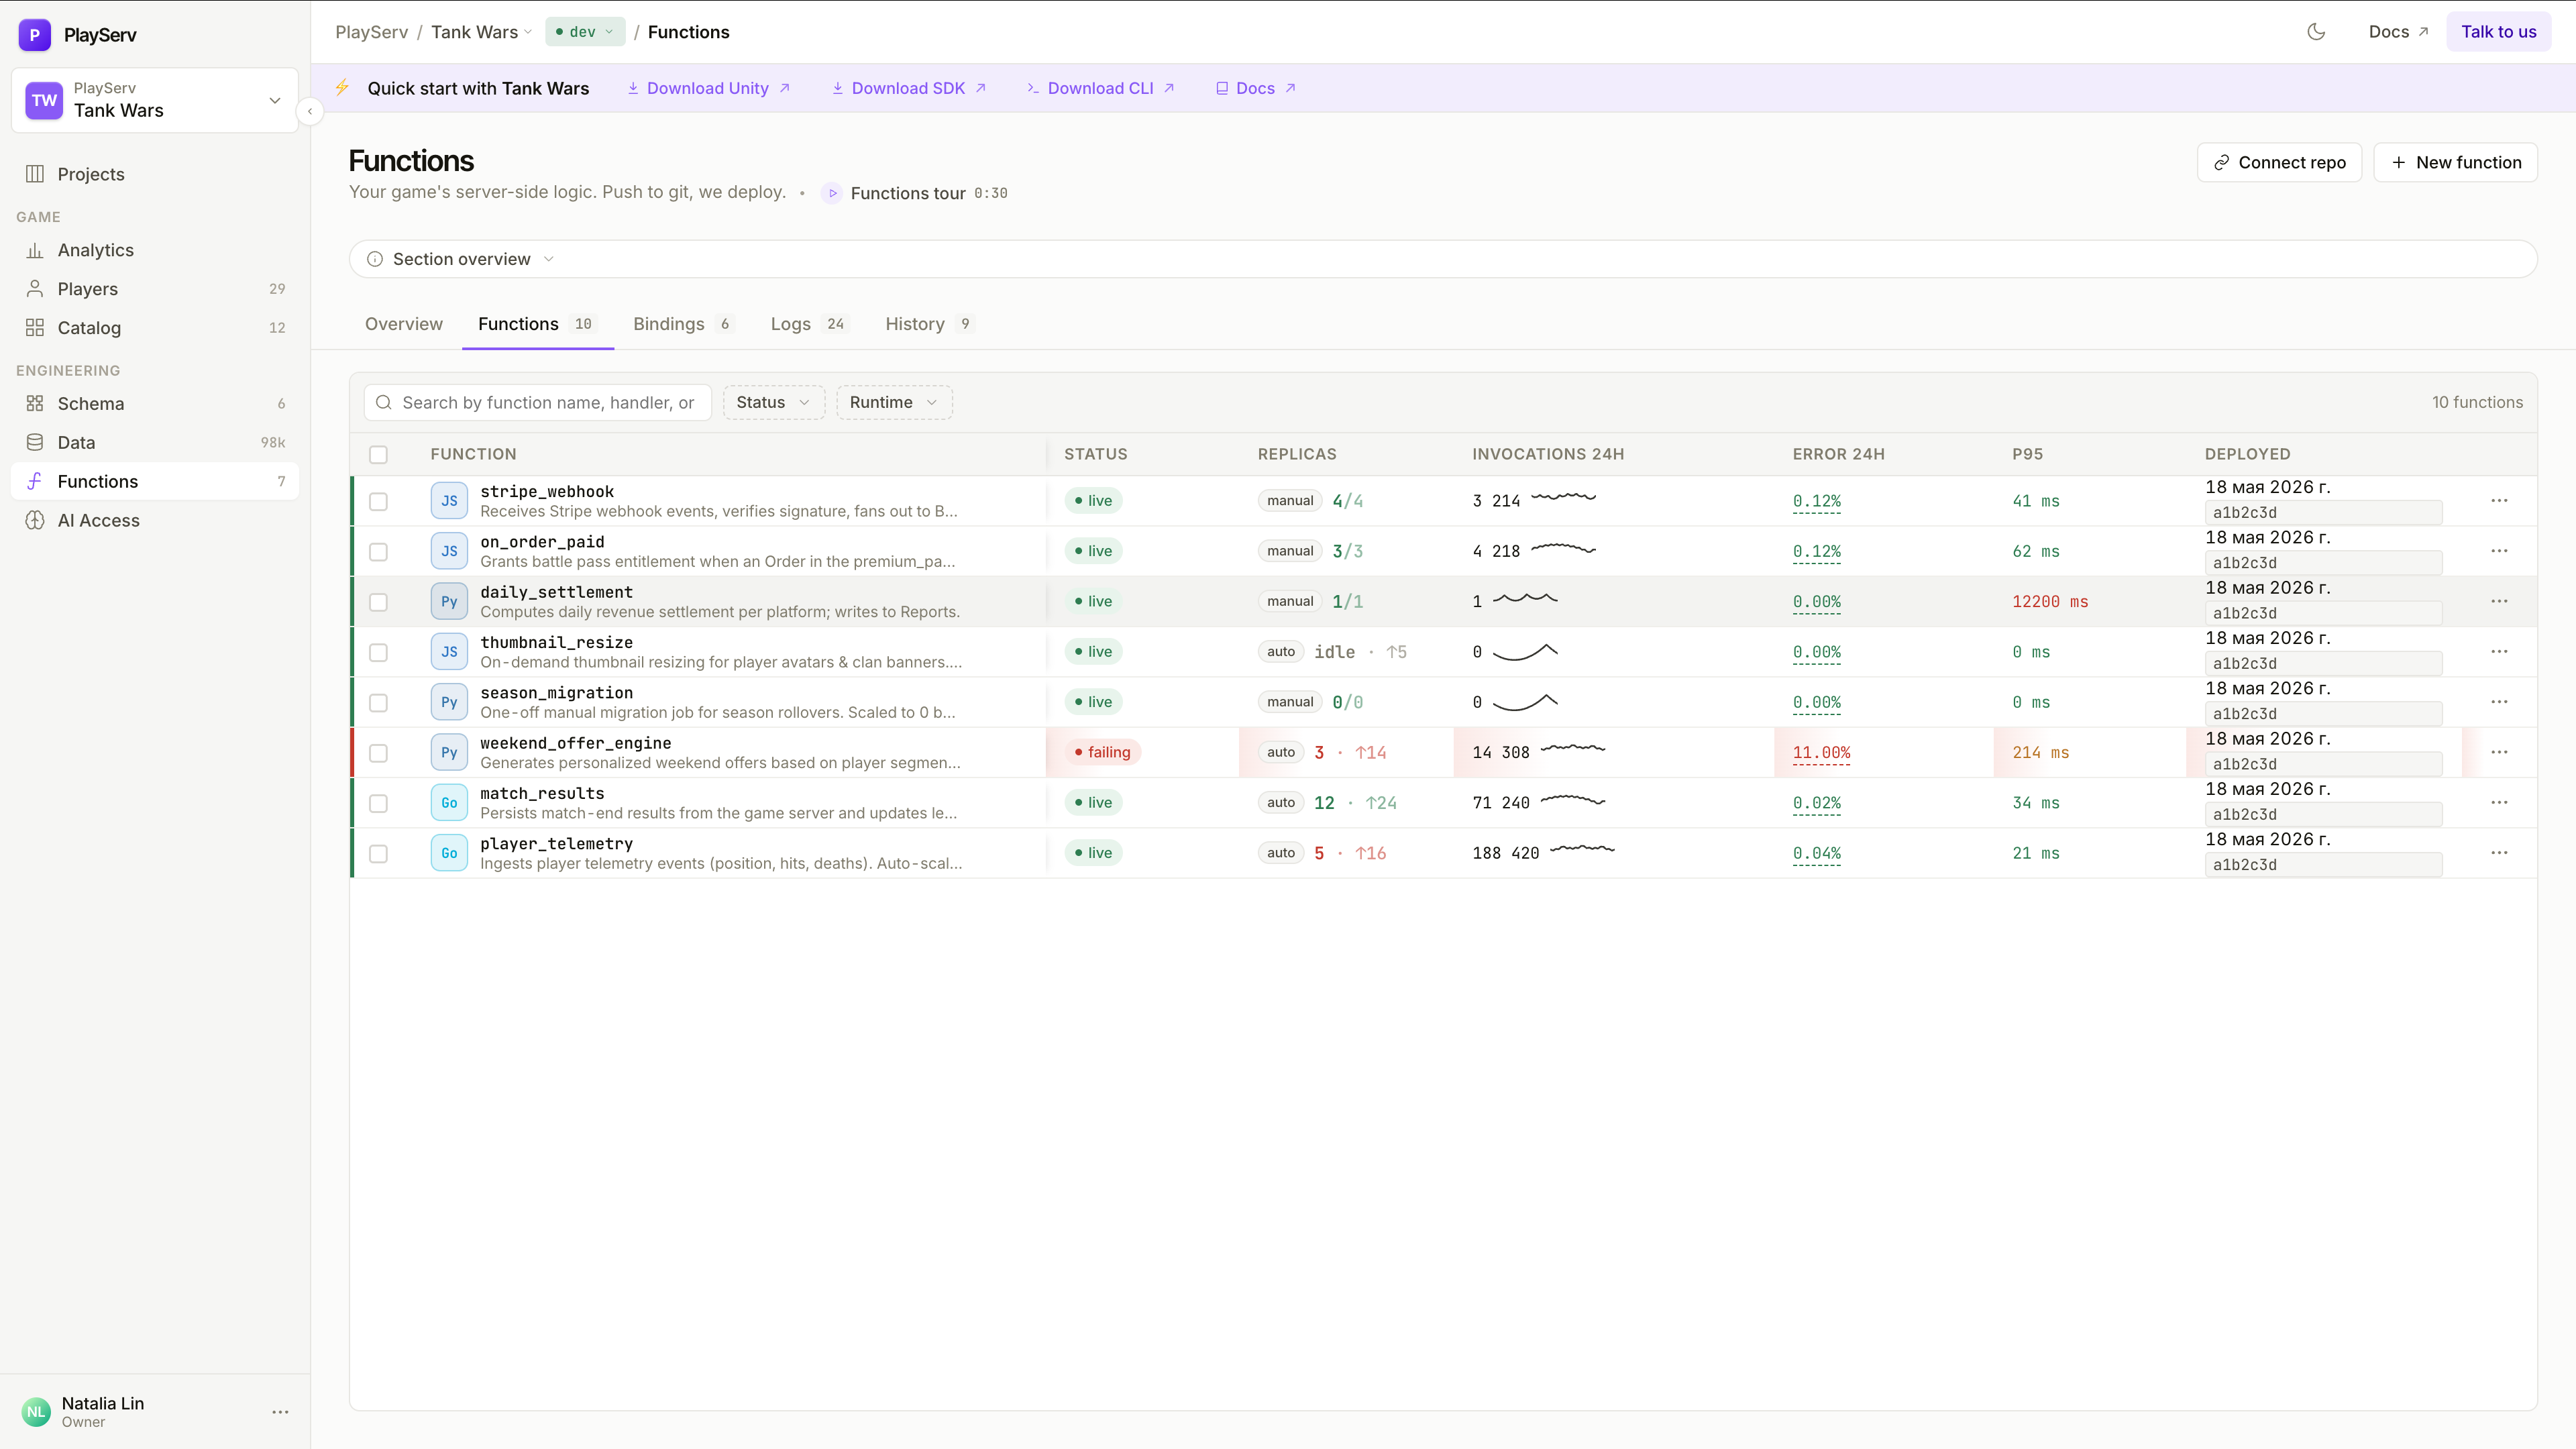
Search by name, description, or language. Use Status and Runtime dropdowns to filter — useful in larger projects where you only need to see, say, failing Python functions.
Each row surfaces what matters at a glance:
Language badge (Js, Py, Go, C#), function name, and a one-line description from the manifest.
Status badge, replica count (running / desired), invocations for the current and previous 24h period, error rate, P95 latency, and the deployed date with commit SHA.
Statuses
Deployed and actively serving traffic. The normal healthy state.
Deployed but not receiving traffic. Use for canary testing before promoting to live.
Replicas are crashing or errors exceed the configured threshold. Needs attention.
Manually stopped. All replicas are down; the function won't accept invocations.
Click + New function in the top-right to scaffold a new function from a template. This is a coming soon feature — use the CLI to create new functions.
Function detail panel
Click any row to open the detail panel on the right. The header shows the function name, scaling policy, last deploy date with commit SHA, and live status. Four tabs give you full control.
Status
Live health for a single function. Three stat areas at the top:
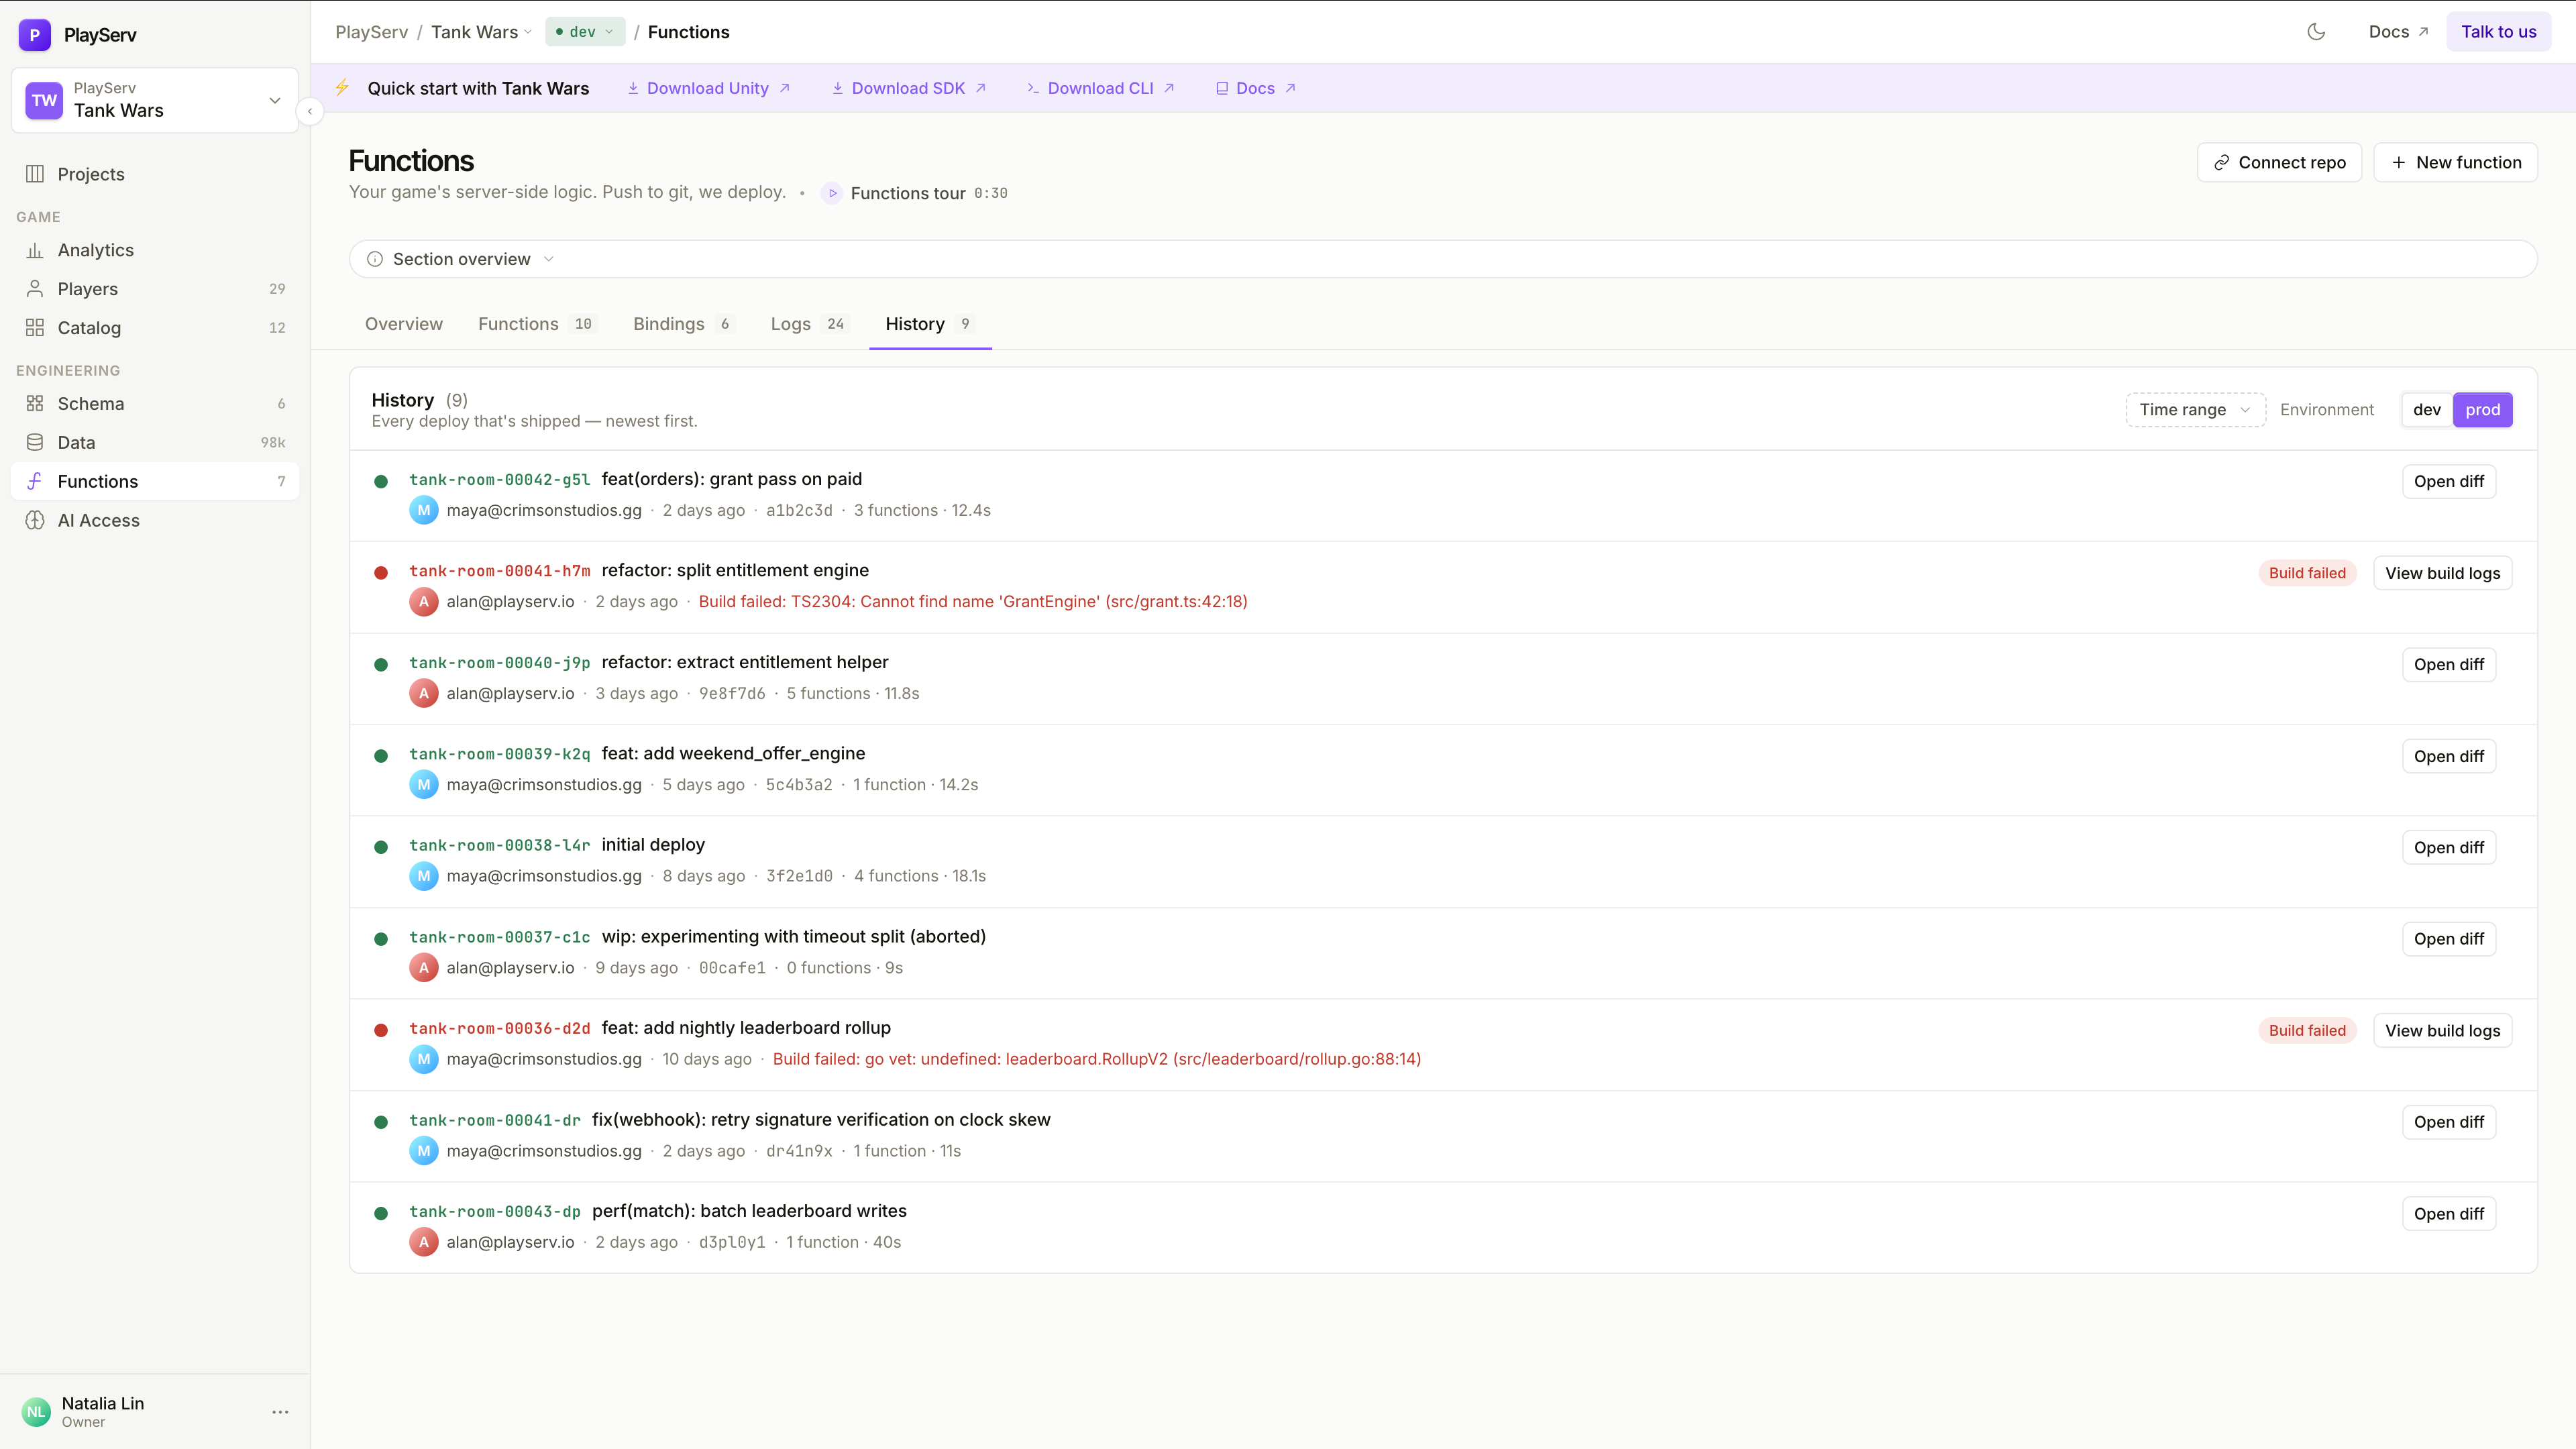
none for public endpoints, or player for protected ones.Replicas lists every active instance with ID, region, uptime, memory, and CPU. Click Scale to adjust replica count immediately — no redeploy. Click any replica row to expand At a glance:
(current)— if noneBindings
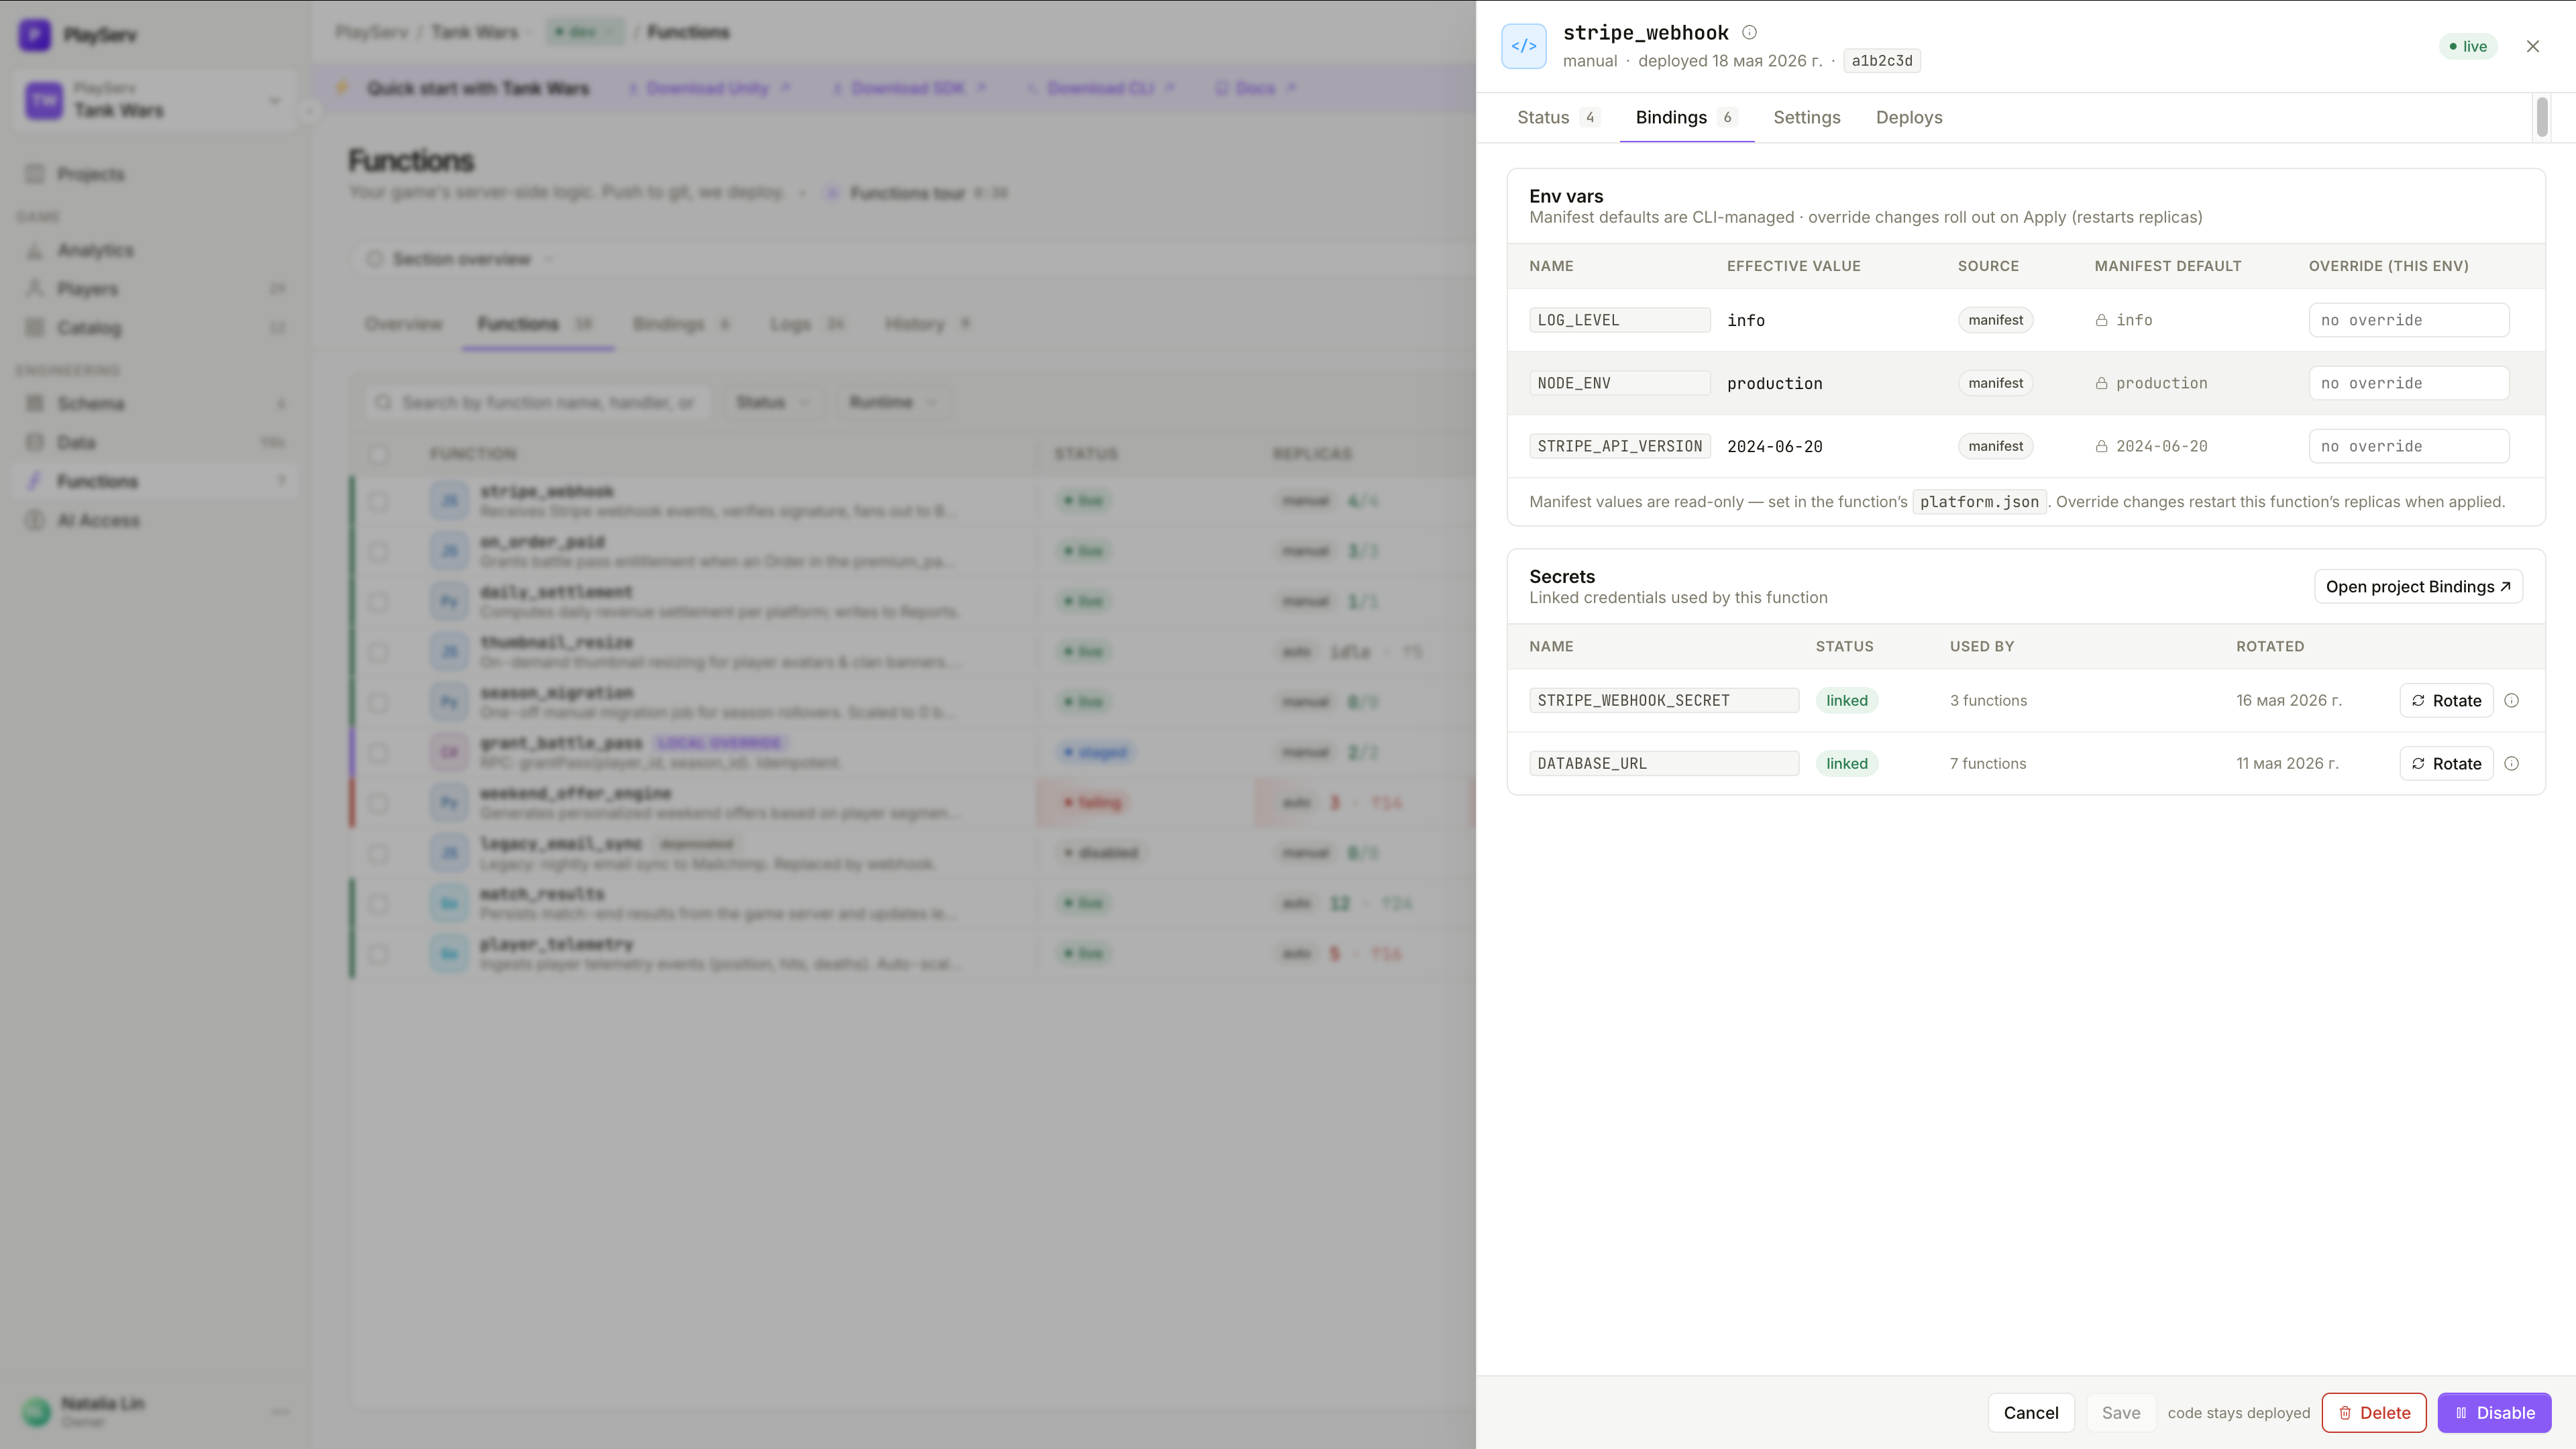
All configuration injected into this function at runtime. Two sections.
Env vars — the full variable table:
LOG_LEVEL, NODE_ENVmanifest — declared in platform.jsonautofixOverrides apply immediately and restart replicas — no redeploy needed. Manifest defaults are read-only here.
Secrets — credentials linked to this function:
STRIPE_WEBHOOK_SECRET, DATABASE_URLlinked when resolved; missing when the secret hasn't been setClick Rotate to generate a new value. Click Open project Bindings → to manage the full set of project-level secrets.
Settings
Runtime behaviour for this function. Saved independently — no code redeploy required.
auto, this is the soft target — the platform autoscales as concurrency approaches the cap.none — anonymous callers allowed; good for public webhooks and open endpoints. player — valid signed token required.manual — you control the replica count. auto — the platform scales based on request concurrency relative to Max concurrency.manual. Click Scale to apply immediately.Deploys
The full deploy history for this specific function — every build that has touched it, newest first.
live · draining (traffic shifting to newer version) · archivedsucceeded, or Build failed with a link to build logslocked for the live and draining deploys; delete icon for archived onesA deploy enters draining while in-flight requests from the previous version finish before traffic fully switches.
The Deploys panel is read-only. The source-of-truth for all deploys is your CLI — you can't trigger or roll back from here.
Bindings tab
The Bindings tab at the top of the Functions section is a project-wide view — every env var across every function in one flat table, with the same columns as the per-function view.
Logs
A real-time, cross-function log stream for the entire environment.
The left panel lists all functions with their unread count. Click to filter; use checkboxes to select multiple. Mark all / Unmark all toggles the full selection.
Each entry: timestamp to milliseconds, level badge (INFO blue · WARN amber · ERROR red), function name, and message. Traced calls show a trace: <id> suffix — all lines from the same invocation share that ID.
Stream controls:
Filter to one function and enable Live while debugging — you'll see output in real time as you trigger invocations.
History
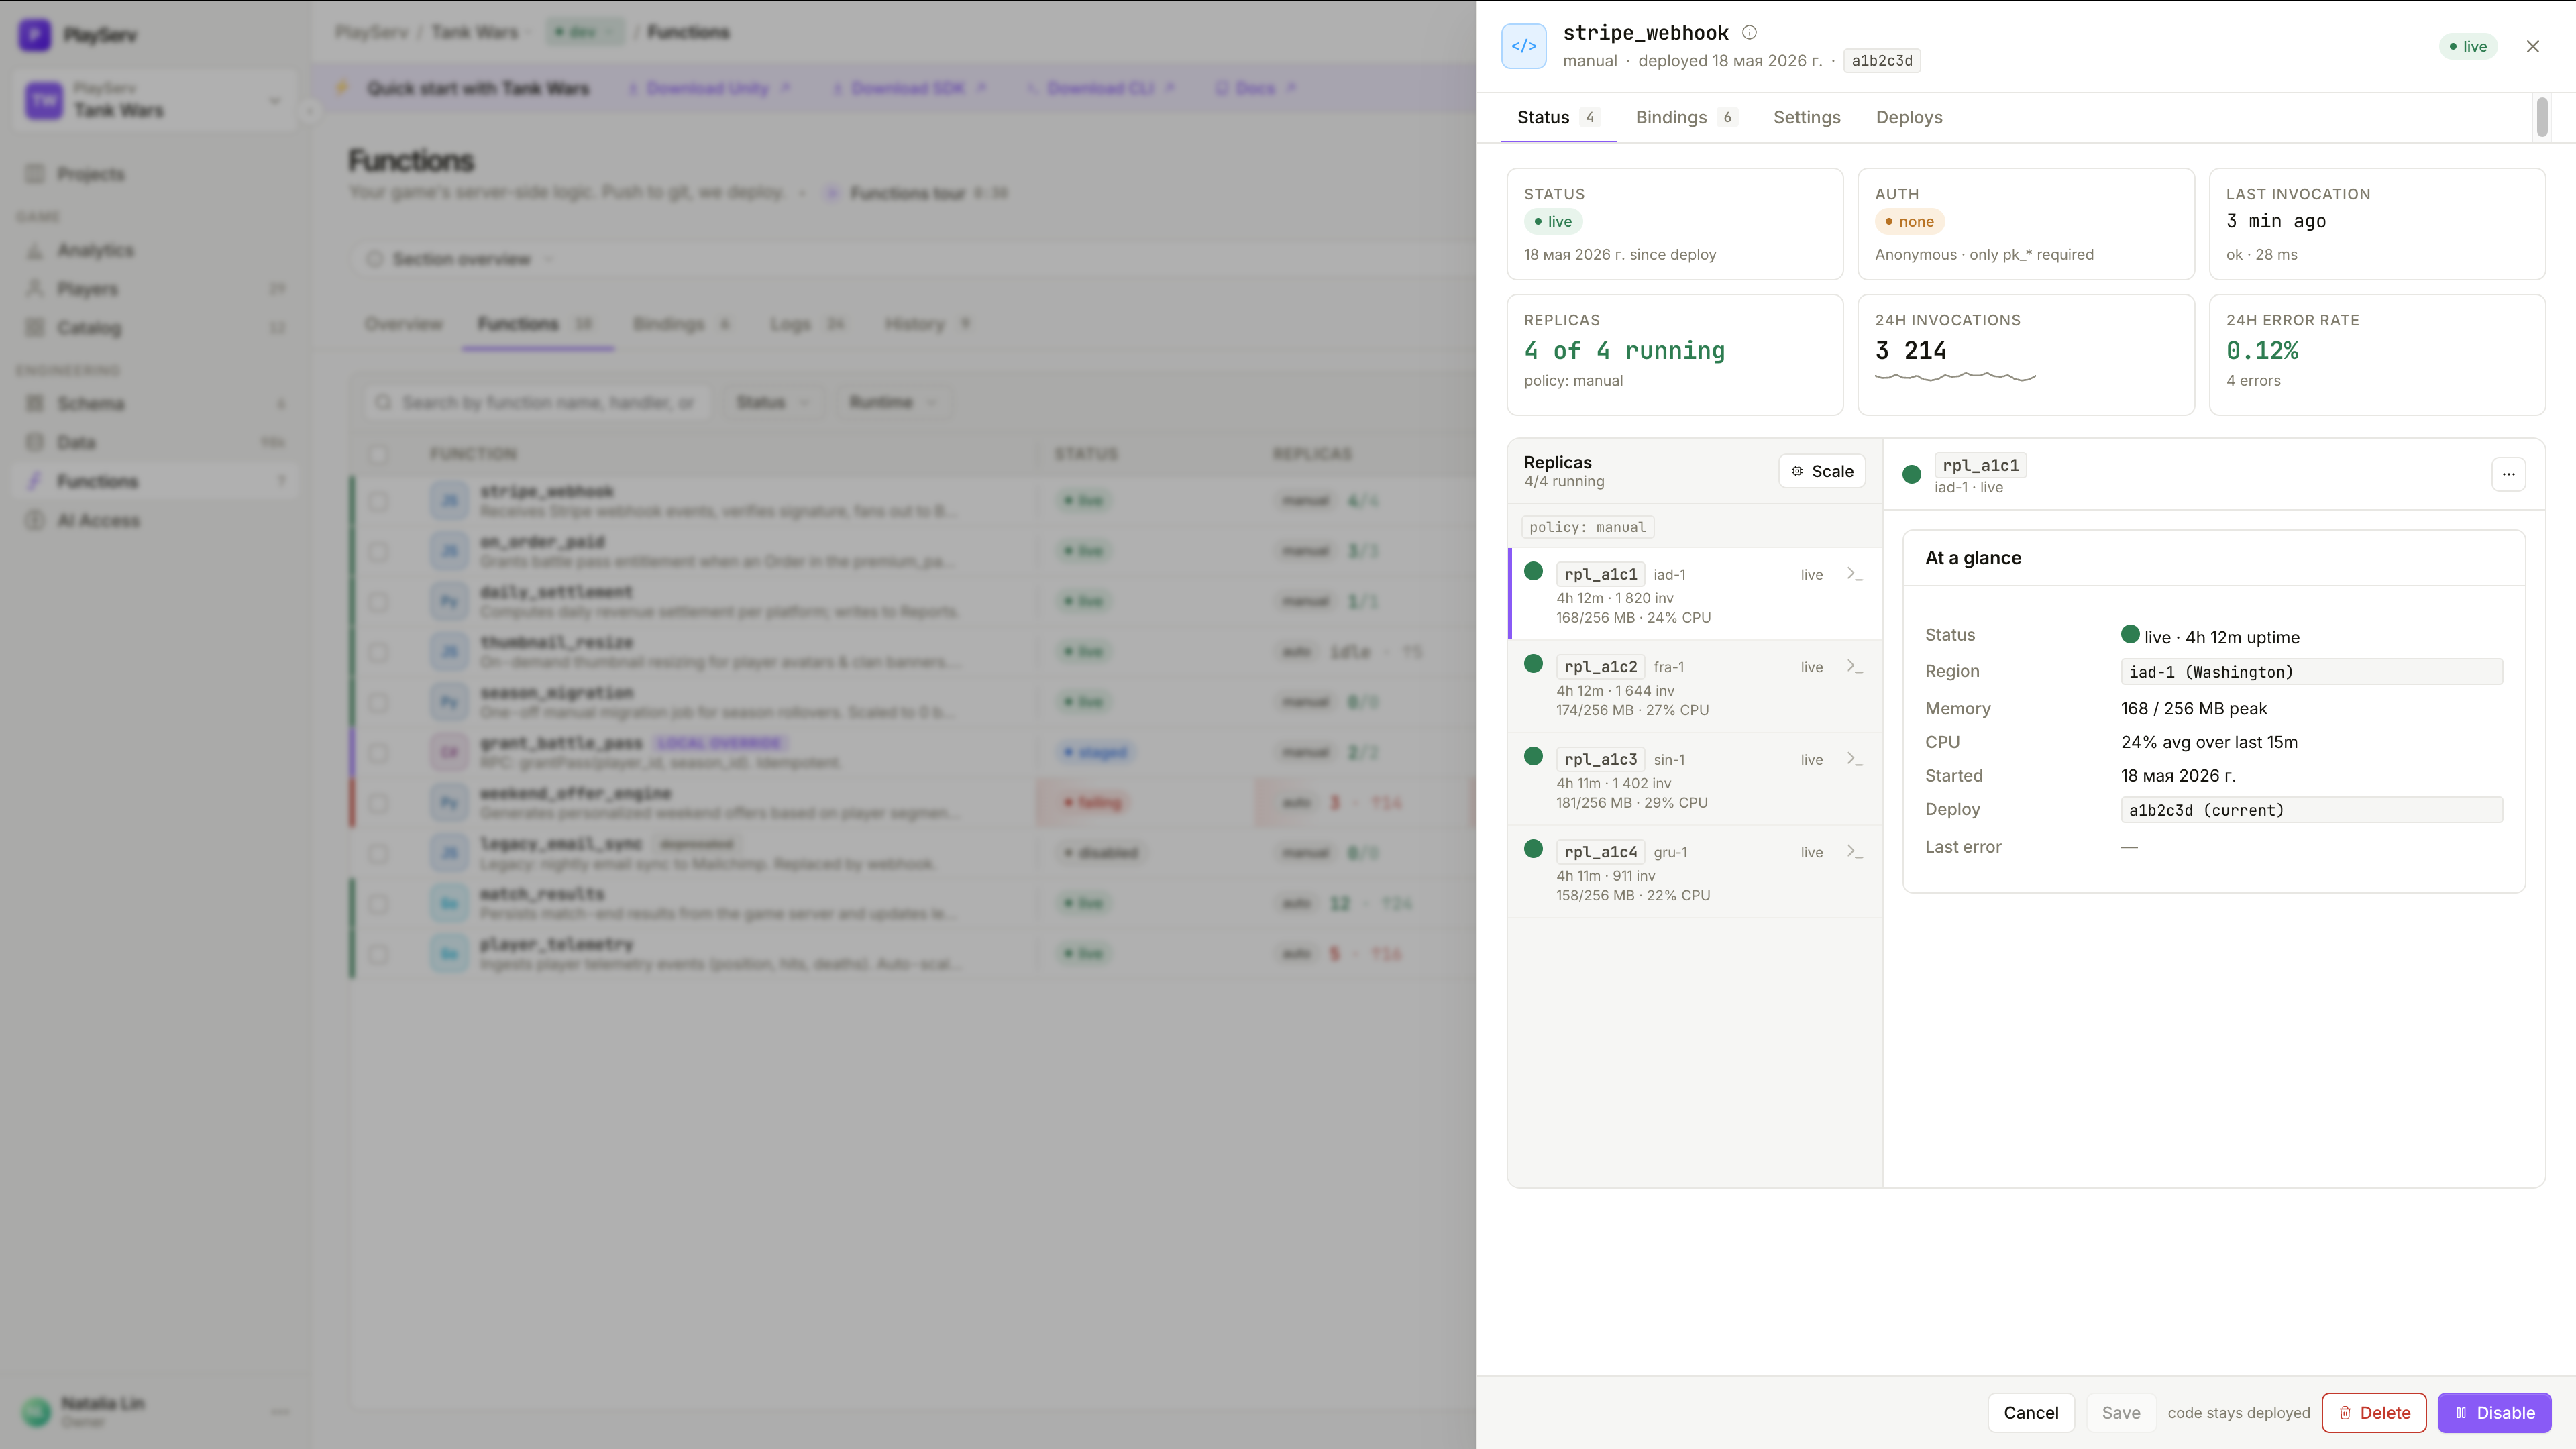
Every deploy that has touched any function in the project — the full project-wide deploy log. Sorted newest first.
Each entry shows a status dot (green = success, red = failed), the git revision with branch and short commit SHA, commit message, author, relative time, number of functions changed, and build duration. Failed builds show a Build failed badge with a View build logs link.
Use Time range and Environment dropdowns to filter.
History includes every shaped deploy — including failed builds and zero-function pushes. Use the Environment filter to separate dev and prod histories.